Unity 使用 Profiler 优化您的游戏
性能是任何游戏的一个关键方面,毫不奇怪,无论游戏有多好,如果它在用户的机器上运行不佳,它就会感觉不那么愉快。
由于并非每个人都拥有高端 PC 或设备(如果您的目标是移动设备),因此在整个开发过程中牢记性能非常重要。
游戏运行缓慢的原因有多种:
- 渲染(过多的高多边形网格、复杂的着色器或图像效果)
- 音频(主要是由不正确的音频导入设置引起的)
- 未优化的代码(在错误位置包含性能要求函数的脚本)
在本教程中,我将展示如何在 Unity Profiler 的帮助下优化代码。
分析器
从历史上看,在 Unity 中调试性能是一项繁琐的任务,但从那时起,添加了一个新功能,称为 Profiler。
Profiler 是 Unity 中的一个工具,可让您通过监控内存消耗来快速查明游戏中的瓶颈,从而大大简化优化过程。

表现不佳
性能不佳随时可能发生:假设您正在处理敌人实例,当您将其放置在场景中时,它可以正常工作,没有任何问题,但当您生成更多敌人时,您可能会注意到 fps(每秒帧数) )开始下降。
检查下面的示例:
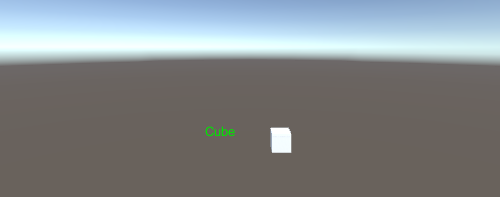
在场景中,我有一个附有脚本的立方体,该脚本将立方体从一侧移动到另一侧并显示对象名称:
SC_显示名称.cs
using System.Collections;
using System.Collections.Generic;
using UnityEngine;
public class SC_ShowName : MonoBehaviour
{
bool moveLeft = true;
float movedDistance = 0;
// Start is called before the first frame update
void Start()
{
moveLeft = Random.Range(0, 10) > 5;
}
// Update is called once per frame
void Update()
{
//Move left and right in ping-pong fashion
if (moveLeft)
{
if(movedDistance > -2)
{
movedDistance -= Time.deltaTime;
Vector3 currentPosition = transform.position;
currentPosition.x -= Time.deltaTime;
transform.position = currentPosition;
}
else
{
moveLeft = false;
}
}
else
{
if (movedDistance < 2)
{
movedDistance += Time.deltaTime;
Vector3 currentPosition = transform.position;
currentPosition.x += Time.deltaTime;
transform.position = currentPosition;
}
else
{
moveLeft = true;
}
}
}
void OnGUI()
{
//Show object name on screen
Camera mainCamera = Camera.main;
Vector2 screenPos = mainCamera.WorldToScreenPoint(transform.position + new Vector3(0, 1, 0));
GUI.color = Color.green;
GUI.Label(new Rect(screenPos.x - 150/2, Screen.height - screenPos.y, 150, 25), gameObject.name);
}
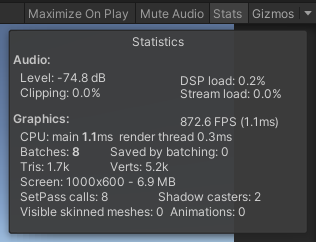
}从统计数据来看,我们可以看到游戏运行在 800+ fps 的水平上,因此对性能几乎没有任何影响。
但是让我们看看当我们复制 Cube 100 次时会发生什么:

FPS下降700多点!
注意:所有测试都是在禁用垂直同步的情况下完成的
一般来说,当游戏开始出现卡顿、冻结或 fps 降至 120 以下时,开始优化是个好主意。
如何使用分析器?
要开始使用 Profiler,您需要:
- 按 Play 开始游戏
- 通过转到“窗口”->“分析”->“探查器”(或按 Ctrl + 7)打开探查器
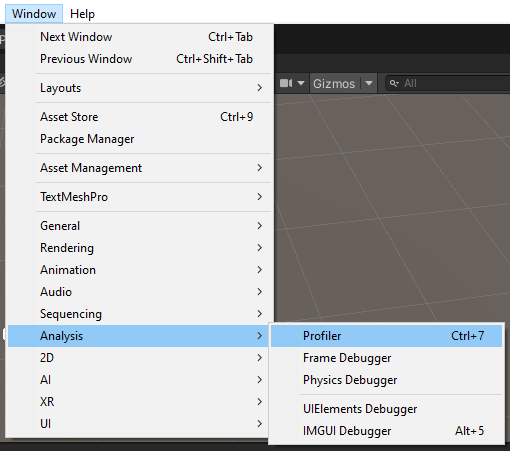
- 将出现新窗口,如下所示:
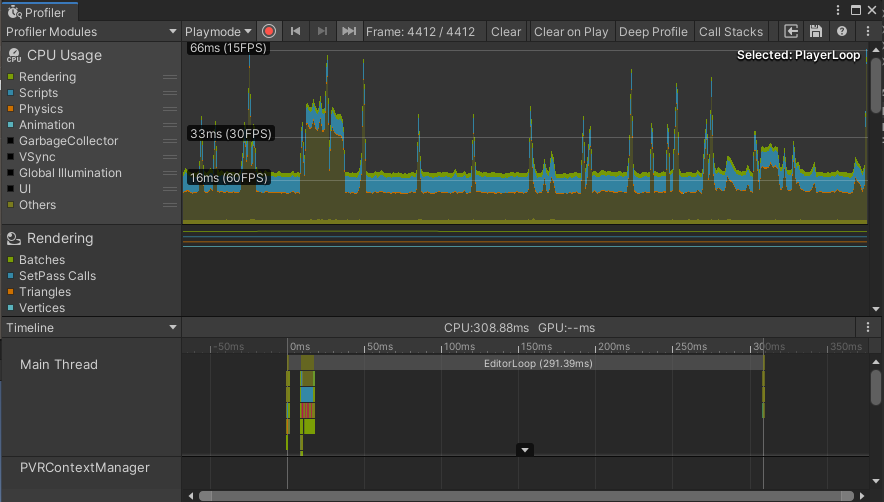
- 一开始它可能看起来很吓人(尤其是所有这些图表等),但这不是我们要查看的部分。
- 单击“时间轴”选项卡并将其更改为“层次结构”:

- 您会注意到 3 个部分(EditorLoop、PlayerLoop 和 Profiler.CollectEditorStats):
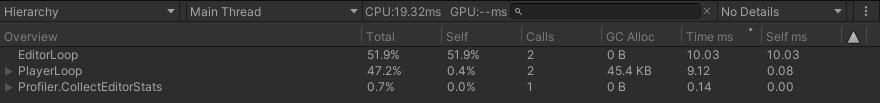
- 展开 PlayerLoop 以查看消耗计算能力的所有部分(注意:如果 PlayerLoop 值未更新,请单击 Profiler 窗口顶部的 "Clear" 按钮)。
为了获得最佳结果,请将您的游戏角色引导至游戏最滞后的情况(或地点)并等待几秒钟。
- 稍等片刻后,停止游戏并观察 PlayerLoop 列表
您需要查看 GC Alloc 值,它代表垃圾收集分配。这是一种已由 component 分配但不再需要并等待垃圾收集释放的内存类型。理想情况下,代码不应生成任何垃圾(或尽可能接近 0)。
时间 ms 也是一个重要的值,它显示了代码运行所花费的时间(以毫秒为单位),因此理想情况下,您也应该致力于减少该值(通过缓存值、避免每次更新调用对性能要求较高的函数等).)。
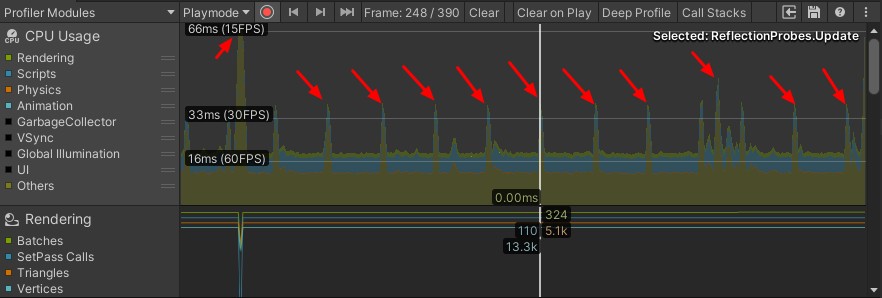
为了更快地找到麻烦的部分,点击GC Alloc栏,将值从高到低排序)
- 在 CPU 使用率图表中,单击任意位置即可跳到该帧。具体来说,我们需要查看 fps 最低的峰值:
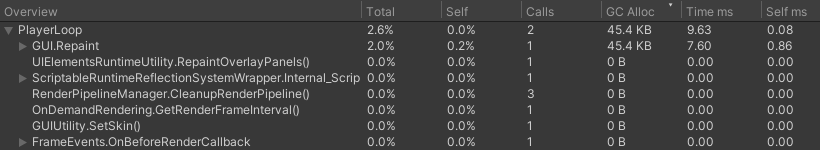
下面是 Profiler 揭示的内容:

GUI.Repaint 正在分配 45.4KB,这相当多,扩展它会显示更多信息:

- 它表明大部分分配来自 SC_ShowName 脚本中的 GUIUtility.BeginGUI() 和 OnGUI() 方法,知道我们可以开始优化。
GUIUtility.BeginGUI() 表示一个空的 OnGUI() 方法(是的,即使是空的 OnGUI() 方法也会分配相当多的内存)。
使用 Google(或其他搜索引擎)查找您不认识的名字。
下面是需要优化的OnGUI()部分:
    void OnGUI()
    {
        //Show object name on screen
        Camera mainCamera = Camera.main;
        Vector2 screenPos = mainCamera.WorldToScreenPoint(transform.position + new Vector3(0, 1, 0));
        GUI.color = Color.green;
        GUI.Label(new Rect(screenPos.x - 150/2, Screen.height - screenPos.y, 150, 25), gameObject.name);
    }
优化
让我们开始优化。
每个 SC_ShowName 脚本都调用自己的 OnGUI() 方法,考虑到我们有 100 个实例,这不太好。那么对此可以做什么呢?答案是:使用带有 OnGUI() 方法的单个脚本来调用每个多维数据集的 GUI 方法。
- 首先,我将 SC_ShowName 脚本中的默认 OnGUI() 替换为 public void GUIMethod(),它将从另一个脚本中调用:
    public void GUIMethod()
    {
        //Show object name on screen
        Camera mainCamera = Camera.main;
        Vector2 screenPos = mainCamera.WorldToScreenPoint(transform.position + new Vector3(0, 1, 0));
        GUI.color = Color.green;
        GUI.Label(new Rect(screenPos.x - 150/2, Screen.height - screenPos.y, 150, 25), gameObject.name);
}- 然后我创建了一个新脚本并将其命名为 SC_GUIMethod:
SC_GUIMethod.cs
using UnityEngine;

public class SC_GUIMethod : MonoBehaviour
{
    SC_ShowName[] instances; //All instances where GUI method will be called

    void Start()
    {
        //Find all instances
        instances = FindObjectsOfType<SC_ShowName>();
    }

    void OnGUI()
    {
        for(int i = 0; i < instances.Length; i++)
        {
            instances[i].GUIMethod();
        }
    }
}
SC_GUIMethod 将附加到场景中的随机对象并调用所有 GUI 方法。
- 我们从拥有 100 个单独的 OnGUI() 方法变成只有一个,让我们按播放键看看结果:
![]()
- GUIUtility.BeginGUI() 现在只分配 368B 而不是 36.7KB,大大减少了!
但是,OnGUI() 方法仍在分配内存,但由于我们知道它仅从 SC_ShowName 脚本调用 GUIMethod(),因此我们将直接调试该方法。
但是Profiler只显示全局信息,我们如何查看方法内部究竟发生了什么?
为了在方法内部进行调试,Unity 有一个方便的 API,名为 Profiler.BeginSample
Profiler.BeginSample 允许您捕获脚本的特定部分,显示完成所需的时间以及分配了多少内存。
- 在代码中使用Profiler类之前,我们需要在脚本开头导入UnityEngine.Profiling命名空间:
using UnityEngine.Profiling;- 通过在捕获开始处添加 Profiler.BeginSample("SOME_NAME"); 并在捕获结束处添加 Profiler.EndSample(); 来捕获分析器示例,例如这:
        Profiler.BeginSample("SOME_CODE");
        //...your code goes here
        Profiler.EndSample();
由于我不知道 GUIMethod() 的哪一部分导致内存分配,因此我将每一行包含在 Profiler.BeginSample 和 Profiler.EndSample 中(但是如果您的方法有很多行,则绝对不需要包含每行,只需将其分成均匀的块,然后从那里开始工作)。
这是实现了 Profiler Samples 的最终方法:
    public void GUIMethod()
    {
        //Show object name on screen
        Profiler.BeginSample("sc_show_name part 1");
        Camera mainCamera = Camera.main;
        Profiler.EndSample();

        Profiler.BeginSample("sc_show_name part 2");
        Vector2 screenPos = mainCamera.WorldToScreenPoint(transform.position + new Vector3(0, 1, 0));
        Profiler.EndSample();

        Profiler.BeginSample("sc_show_name part 3");
        GUI.color = Color.green;
        GUI.Label(new Rect(screenPos.x - 150/2, Screen.height - screenPos.y, 150, 25), gameObject.name);
        Profiler.EndSample();
}- 现在我按“播放”并查看分析器中显示的内容:
- 为了方便起见,我在探查器中搜索 "sc_show_",因为所有示例都以该名称开头。
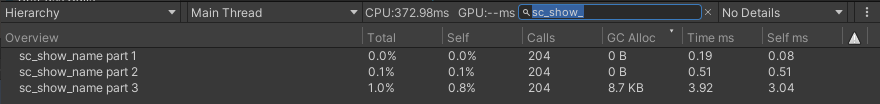
- 有趣... sc_show_names 第 3 部分分配了大量内存,对应于这部分代码:
        GUI.color = Color.green;
        GUI.Label(new Rect(screenPos.x - 150/2, Screen.height - screenPos.y, 150, 25), gameObject.name);
经过一番谷歌搜索后,我发现获取对象的名称会分配相当多的内存。解决方案是在 void Start() 中将对象的名称分配给字符串变量,这样它只会被调用一次。
这是优化后的代码:
SC_显示名称.cs
using UnityEngine;
using UnityEngine.Profiling;

public class SC_ShowName : MonoBehaviour
{
    bool moveLeft = true;
    float movedDistance = 0;

    string objectName = "";

    // Start is called before the first frame update
    void Start()
    {
        moveLeft = Random.Range(0, 10) > 5;
        objectName = gameObject.name; //Store Object name to a variable
    }

    // Update is called once per frame
    void Update()
    {
        //Move left and right in ping-pong fashion
        if (moveLeft)
        {
            if(movedDistance > -2)
            {
                movedDistance -= Time.deltaTime;
                Vector3 currentPosition = transform.position;
                currentPosition.x -= Time.deltaTime;
                transform.position = currentPosition;
            }
            else
            {
                moveLeft = false;
            }
        }
        else
        {
            if (movedDistance < 2)
            {
                movedDistance += Time.deltaTime;
                Vector3 currentPosition = transform.position;
                currentPosition.x += Time.deltaTime;
                transform.position = currentPosition;
            }
            else
            {
                moveLeft = true;
            }
        }
    }

    public void GUIMethod()
    {
        //Show object name on screen
        Profiler.BeginSample("sc_show_name part 1");
        Camera mainCamera = Camera.main;
        Profiler.EndSample();

        Profiler.BeginSample("sc_show_name part 2");
        Vector2 screenPos = mainCamera.WorldToScreenPoint(transform.position + new Vector3(0, 1, 0));
        Profiler.EndSample();

        Profiler.BeginSample("sc_show_name part 3");
        GUI.color = Color.green;
        GUI.Label(new Rect(screenPos.x - 150/2, Screen.height - screenPos.y, 150, 25), objectName);
        Profiler.EndSample();
    }
}- 让我们看看 Profiler 显示了什么:
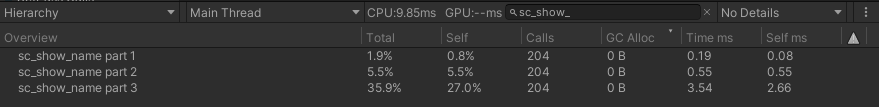
所有样本都分配 0B,因此不再分配内存。